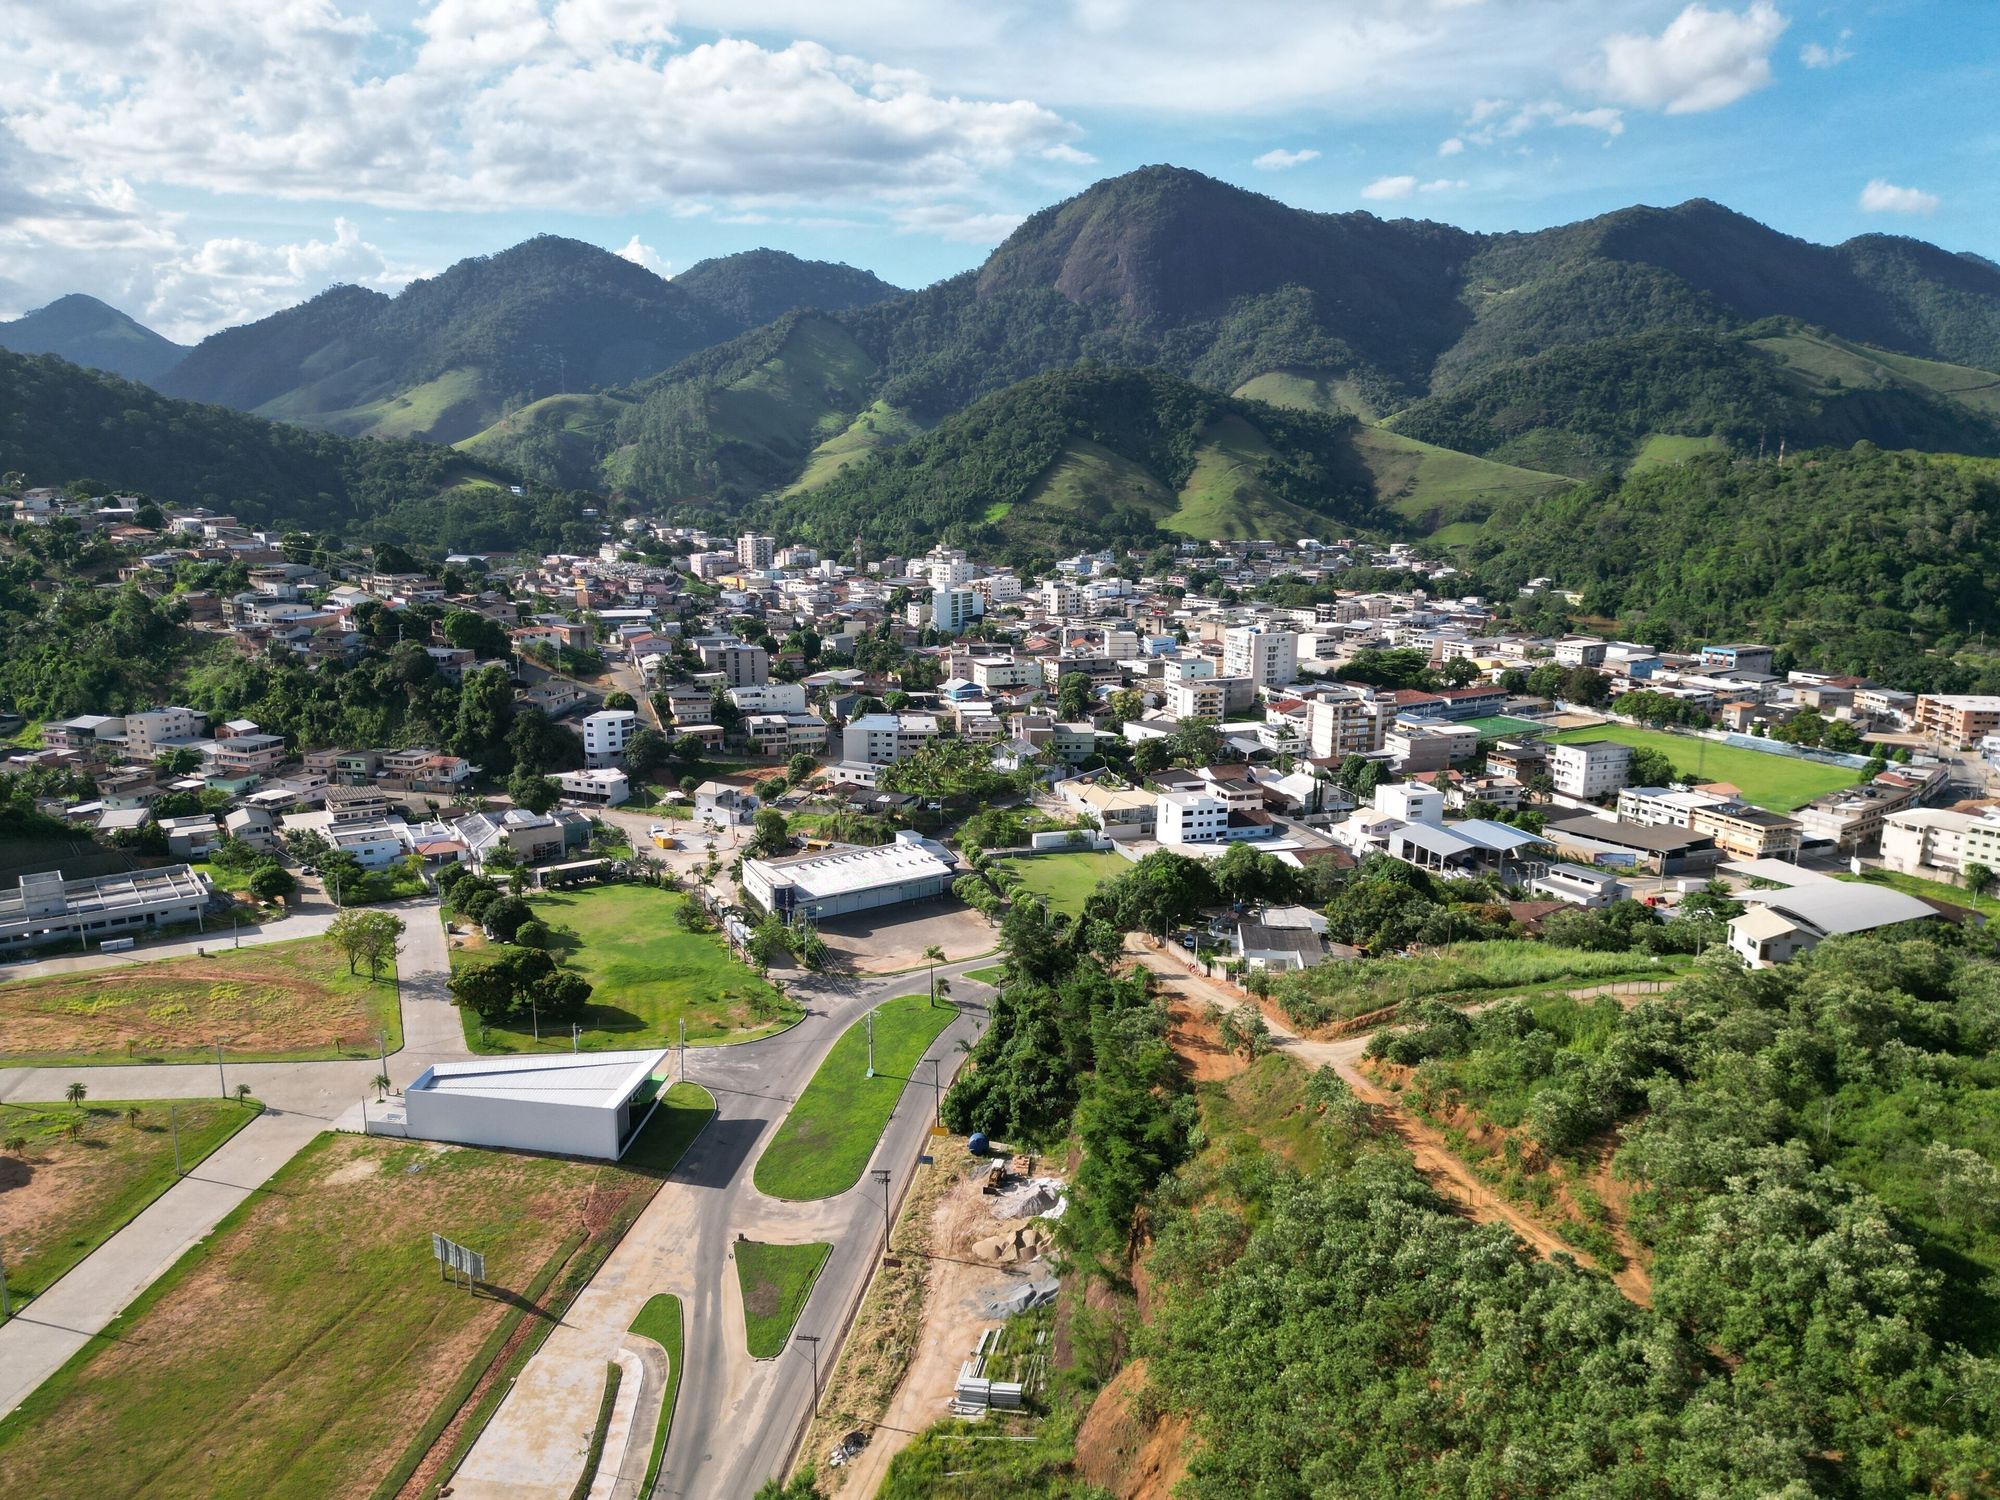
 Aerial view of Alfredo Chaves, ES. Photo: Expedia.
The metamorphosis of power in Alfredo Chaves:we no longer live like our parents
A political base that had lost five straight mayoral elections won all 42 precincts in 2024 (58.1% of valid votes) with no change in turnout: the data indicate the turnaround came from people who already voted, across the whole territory. Built only from open data, the reconstruction works as a method for any Brazilian municipality.
We no longer live like our parents
The title is a reference to “Como Nossos Pais” (“Like Our Parents”), by Belchior (1976, immortalized in Elis Regina's voice), one of the most iconic songs in Brazilian popular music. It's about people who insist on living stuck in the past and fail to notice that the new always arrives, sooner or later. Here that theme takes on a literal meaning: the data in this study shows, precinct by precinct, year by year, twenty years of an old political guard that survived five straight elections before finally being replaced. A metamorphosis of power, and, within it, the real distance between my father's defeated candidacy in 2004 and my brother's win two decades later.
Five losses and the turnaround
Before the 2020→2024 turnaround documented below, this same municipality carries a longer story. From 2004 to 2020, the group behind this candidacy lost five consecutive mayoral elections in Alfredo Chaves, Brazil. In 2004 the candidate was Jorge Gabriel Meneghel, my father. The family and political lineage runs through every cycle since, up to my brother Hugo Luiz in 2024. The chart below is built from the same official TSE data by voting precinct, across all six elections, and shows the vote share closing the gap, cycle by cycle, until 2024.
Line chart with the mayoral vote share of the group and of the main opposition candidacy in six elections, from 2004 to 2024. The group goes from 26.4% in 2004 to 48.0% in 2016, falls to 40.0% in 2020 and reaches 58.1% in 2024; the opposition stays above the group through 2020 (from 66.9% to 56.4%) and drops to 31.9% in 2024. Blue dots show the other candidates (Luiz Teixeira and Nelsão Togneri in 2004, Armando Zanata in 2020 and Boldrini in 2024), and a list names every candidate of each election.
official TSE result; the dot marks the side: green = group, red = main opposition, blue = other candidates
| Year | Candidate | Party | Votes | % of valid votes | Result |
|---|---|---|---|---|---|
| 2004 | Dr. Fernando | PSB | 5,330 | 66.9% | Elected |
| 2004 | Jorge Meneghel | PT | 2,107 | 26.4% | Not elected |
| 2004 | Luiz Teixeira | PV | 299 | 3.8% | Not elected |
| 2004 | Nelsão Togneri | PFL | 236 | 3.0% | Not elected |
| 2008 | Dr. Fernando | PSB | 5,996 | 66.9% | Elected |
| 2008 | Daniel Orlandi | PSDB | 2,969 | 33.1% | Not elected |
| 2012 | Roberto Fiorin | PSB | 5,615 | 63.6% | Elected |
| 2012 | Sergio Bianchi | PSD | 3,215 | 36.4% | Not elected |
| 2016 | Dr. Fernando | PSB | 5,019 | 52.0% | Elected |
| 2016 | Ronaldo Bianchi | PMDB | 4,641 | 48.0% | Not elected |
| 2020 | Dr. Fernando | PSB | 5,196 | 56.4% | Elected |
| 2020 | Ronaldo Bianchi | Republicanos | 3,681 | 40.0% | Not elected |
| 2020 | Armando Zanata | PDT | 336 | 3.6% | Not elected |
| 2024 | Hugo Luiz | PP | 5,779 | 58.1% | Elected |
| 2024 | Rolmar Boteccia | PSB | 3,177 | 31.9% | Not elected |
| 2024 | Boldrini | PL | 999 | 10.0% | Not elected |
One election, same political base
I worked as campaign director in the 2024 municipal election in Alfredo Chaves, Brazil, for the majoritarian mayoral candidacy of Hugo Luiz Picoli Meneghel. I wasn't involved in running the 2020 campaign: I use that year's public data only as a comparison point, to measure the distance between the two elections. That year the slate lost the mayoral race, winning just 1 of the 36 voting precincts that existed at the time; Hugo Luiz had already been elected to the City Council in that same election, but as part of a bloc holding only 3 of 9 seats, a clear minority. In 2024, also coordinating the campaigns of the coalition's other council candidates, the same political base won all 42 voting precincts in the municipality: Hugo Luiz became the youngest mayor in the history of Espírito Santo state, and the slate's bloc grew from 3 to 5 of the 9 seats on the Council, from minority to majority.
This document reconstructs that turnaround entirely from open, official TSE data, without relying on memory, internal campaign spreadsheets, or any non-public record. It's an exercise in technical analysis over a real electoral dataset.
TSE's Open Electoral Data Repository
Every number in this study comes from extracts of the TSE Open Data Portal (Brazil's Superior Electoral Court), filtered to the municipality of Alfredo Chaves, Espírito Santo (TSE code 56057), electoral zone 012, for the six municipal elections from 2004 to 2024. Table 3.1 (section 03) shows what exists for each year:
votacao_secao_YEAR_ES.csv: votes by voting precinct, 2004 to 2024 (from 1,229 rows in 2004 to 2,089 in 2024, after the municipal filter)votacao_candidato_munzona_YEAR_ES.csv: consolidated result per candidate, 2004 to 2024 (45 to 73 records per election, adding mayoral, vice-mayoral and council candidates)votacao_partido_munzona_2020/2024_ES.csv: party-line vote totals, 2020 and 2024 only (9 and 11 records)detalhe_votacao_munzona_YEAR_ES.csv: turnout, abstention, blank/null votes, 2004 to 2024prestacao_de_contas_eleitorais_candidatos_YEAR.csv(revenue and paid expenses, 2004 to 2024): extracted via HTTP range requests from a ~1.3 GB national file, without downloading the whole thingbem_candidato_YEAR_ES.csv: assets declared by candidates, 2008 to 2024perfil_eleitor_secao_YEAR_ES.csv: electorate profile by precinct (gender, age bracket, education), 2008 to 2024consulta_cand_YEAR_ES.csv: candidacy registry, 2004 to 2024 (gender, date of birth, education and occupation; race/color is only recorded from 2016)
Additional sources
Several sections of this study cross-reference or cite sources outside the TSE repository, always identified where they appear:
- IBGE, SIDRA: table 6579 (estimated resident population, section 06) and tables 9514 and 9605 of the 2022 Demographic Census (sex and race/color, section 06).
- IBGE, Territorial Meshes: the municipality's official boundary, used in the polling-location map (section 09).
- Alfredo Chaves city hall: the official list of districts and localities, used to assign each voting precinct to a district (section 04).
- TSE, pesqele‑divulgação: the election-poll registration system (Law 9,504/97, Article 33), consulted for the 9 polls from 2024 (section 08).
- Alfredo Chaves City Council, SPL: the legislative record consulted for Commendation Motion No. 003/2024 (section 06).
- The candidacy's official Instagram (@hugoluiz11_): the 2024 post history, the only source in this study that isn't public, auditable data (section 07, with caveats detailed there).
- IPESES: a post-election opinion poll from March 2026, cited as additional context, outside the TSE's electoral scope (section 08).
Data-processing pipeline
The raw extracts go through five steps before any comparative analysis: a standard ingestion, cleaning, and load pipeline, implemented in Python (pandas), with the analytical layer in SQL (SQLite). A SQLite database gathers all six elections (votes by precinct, candidates, turnout and districts) and five SQL queries reproduce the study's central results; a script checks each result against the pandas pipeline. The financing, assets, profile and IBGE analyses read the filtered CSVs directly in pandas, with the same cleaning rules. The interactive charts illustrating the study are written in TypeScript (React and Recharts) and styled with CSS.
;-separated, UTF-8), raw typing as textvotos_secao, candidatos, detalhe_votacao, local_secao, grupo_eleicao) and 2 viewscoverage of the TSE datasets used in this study
| Year | Voting precincts | Candidates | Revenue and expenses | Declared assets | Electorate profile | Party-line votes | Candidate profile | |
|---|---|---|---|---|---|---|---|---|
| Mayoral | Council | |||||||
| 2004 | 33 | 4 | 40 | Yes | No | No | No | Yes |
| 2008 | 34 | 2 | 41 | Yes | Yes | Yes | No | Yes |
| 2012 | 34 | 2 | 64 | Yes | Yes | Yes | No | Yes |
| 2016 | 36 | 2 | 61 | Yes | Yes | Yes | No | Yes |
| 2020 | 36 | 3 | 69 | Yes | Yes | Yes | Yes | Yes |
| 2024 | 42 | 3 | 70 | Yes | Yes | Yes | Yes | Yes |
Cleaning and normalization (pandas)
-- precincts won by the group, by year (sql/02_secoes_vencidas.sql, 2004 to 2024)
SELECT ano, COUNT(*) AS secoes,
       SUM(CASE WHEN votos_grupo > 0 AND votos_grupo = max_secao THEN 1 ELSE 0 END) AS secoes_vencidas
FROM v_prefeito_secao   -- valid votes: excludes blank (95) and null (96) ballots
GROUP BY ano
-- result: 2020 = 1 of 36 precincts; 2024 = 42 of 42
Comparative analysis (SQL)
-- winner of each precinct, by year (highest nominal vote count for Mayor)
SELECT NR_SECAO, NM_VOTAVEL, SUM(QT_VOTOS) AS votes
FROM secao_2024
WHERE DS_CARGO = 'Prefeito' AND NR_VOTAVEL > 0
GROUP BY NR_SECAO, NM_VOTAVEL
-- (identical for secao_2020; winner = MAX(votes) per NR_SECAO)
Joining 2020 ⋈⋈ 2024 by precinct number allows comparison of only the 36 precincts present in both elections (6 new precincts were created by 2024, reflecting electorate growth, and enter the analysis only as a 2024 result).
From a broad defeat to a win in every precinct
In 2020, this political base's majoritarian candidacy won just 1 of 36 comparable precincts (precinct 9), taking 40.0% of the valid vote citywide (3,681 votes), against 56.4% for the winning candidate. In 2024, the same base, now under the coalition “Renovação e Juventude” (“Renewal and Youth”; Republicanos / PP / MDB / PSDB‑Cidadania federation), won all 42 precincts in the municipality, with 58.1% of the valid vote (5,779 votes).
Line chart connecting the mayoral candidate's vote share in each voting precinct, 2020 on the left and 2024 on the right, showing nearly every line rising from below the 50% threshold to above it.
Of the 36 comparable precincts, 31 moved from a minority (<50%) to an absolute majority (≥50%) of the valid vote between the two elections, a swing averaging 17.9 percentage points in those precincts.
Grid showing all 42 numbered voting precincts, colored by category: precincts that flipped from a loss to a win, the one already won in 2020, and new precincts created by 2024.
Bar chart comparing the mayoral candidate's total valid votes in 2020 (3,681 votes, 40.0%) and 2024 (5,779 votes, 58.1%).
A different party every election
The consulta_cand data shows the group's candidate never ran under the same party twice in twenty years: PT in 2004, PSDB in 2008, PSD in 2012, PMDB in 2016, Republicanos in 2020, PP in 2024. The ideological spectrum shifted too, from a left-wing party in 2004 to center and right-wing parties from 2012 on, tracking the national realignment of Brazilian politics over the period. It doesn't look like an isolated local strategy choice.
Coalition size, though, doesn't explain the win on its own: in 2016, the candidate ran with the largest coalition of the whole series (9 parties) and still lost, with 48.0% of the vote. In 2020, with the smallest coalition (3 parties), he also lost. The 2024 coalition (5 parties: Republicanos, PP, MDB and the PSDB‑Cidadania federation) is mid-sized within the series, neither the largest nor the smallest.
On the opposing side, the pattern is the reverse. In the five elections this group lost, between 2004 and 2020, the winner was always PSB: Dr. Fernando took 2004, 2008, 2016 and 2020, and Roberto Fiorin, also PSB, took 2012, four terms and two different names under the same party label, twenty years straight. That streak only breaks in 2024, when Rolmar Boteccia tries to keep PSB in power and loses to Hugo Luiz's PP. In other words, while the losing side changed parties every election, the winning side had a stable label for two decades. It was precisely that stability that broke in 2024, along with the result.
the group's candidate and the winner of each race, election by election
Group's candidate
| Year | Group's party | Spectrum | Parties | Coalition |
|---|---|---|---|---|
| 2004 | PT | Left | 5 | PPS / PT / PSDB / PTN / PT do B |
| 2008 | PSDB | Center-right | 5 | PTB / PSDB / PMDB / PT do B / PPS |
| 2012 | PSD | Center-right | 6 | PT / PTB / PMDB / PPS / DEM / PSD |
| 2016 | PMDB | Center | 9 | PMDB / PPS / PSD / PTB / PT / PDT / PATRIOTA / REDE / DEM |
| 2020 | Republicanos | Right | 3 | PTB / REPUBLICANOS / PATRIOTA |
| 2024 | PP | Right | 5 | REPUBLICANOS / PP / MDB / PSDB‑Cidadania federation |
Winning candidate
| Year | Winner | Party | Spectrum | Parties | Coalition |
|---|---|---|---|---|---|
| 2004 | Dr. Fernando | PSB | Center-left | 5 | PSB / PP / PTB / PL / PMN |
| 2008 | Dr. Fernando | PSB | Center-left | 7 | PR / PP / PRTB / PV / PRB / PHS / PSB |
| 2012 | Roberto Fiorin | PSB | Center-left | 6 | PRB / PP / PDT / PR / PSB / PSDB |
| 2016 | Dr. Fernando | PSB | Center-left | 9 | PSB / PROS / PMN / PSDB / PP / PSC / PR / PTN / PV |
| 2020 | Dr. Fernando | PSB | Center-left | 7 | PP / PSL / PODE / CIDADANIA / DEM / PSB / PSDB |
| 2024 | Hugo Luiz (group) | PP | Right | 5 | REPUBLICANOS / PP / MDB / PSDB‑Cidadania federation |
consulta_cand, field DS_COMPOSICAO_COLIGACAO, TSE, per year. Spectrum classified by the candidacy's party of registration (lead party), not the whole coalition. The green row is the only win in the series; the other five are losses (each coalition's size is discussed in the text above).Source: consulta_cand, fields SG_PARTIDO, DS_COMPOSICAO_COLIGACAO and DS_SIT_TOT_TURNO, TSE, per year. Spectrum classified by the winner's party of registration, not the whole coalition.Where the group was strong, where it was weak
Alfredo Chaves has 7 official districts: the seat and six rural districts (Crubixá, Ibitiruí, Matilde, Ribeirão do Cristo, Sagrada Família and São Bento de Urânia). We cross-referenced each precinct's polling location, and through it its district, with the group's candidate's vote share in each of the six elections, to see whether the turnaround was even across the territory or concentrated in one corner of the municipality.
Map of the seven districts of Alfredo Chaves, each colored between red and green according to the share of mayoral votes won by the group's candidate, with one button per election from 2004 to 2024, and a table with the same percentages. In 2024 the group is above 47% in every district and above 50% in six of seven; in 2020 only Ribeirão do Cristo was above 50%. Above the map, a list names every mayoral candidate of the chosen election; tapping or hovering over a district shows each candidate's vote there.
Source: votacao_secao, TSE, all six elections. Each precinct's district determined by its 2024 polling location, cross-referenced with the official locality list from the Alfredo Chaves city hall. Precinct numbers are stable over time in this municipality (only new precincts are added, none are renumbered), so each precinct's 2024 location applies to every year it existed. Percentages weighted by each precinct's total valid votes. District boundaries: IBGE, 2022 Census district mesh. The division into seven districts (Alfredo Chaves, shown here as “Sede”, the district seat; Crubixá, Ibitiruí, Matilde, Ribeirão do Cristo, Sagrada Família and Urânia, listed as São Bento de Urânia by the city hall) appears in the Municipal Basic Sanitation Plan, item 5.1 (Municipal Law No. 633/2017, repealed by Law No. 668/2019), based on IBGE.
What about the council race?
The same precinct→district mapping, now for the group's full council slate (every candidate in the coalition, elected or not — 35 names in 2020, 30 in 2024, identified by registered party), as a % of valid council votes in each district. Only possible for 2020 and 2024: the only two elections where the family's candidacy also ran a council slate.
Heatmap with Alfredo Chaves' 7 districts as rows and 2020/2024 as columns, showing the percentage of valid council votes that went to the group's slate. Ribeirão do Cristo leads in both years (56.5% in 2020, 69.9% in 2024). Sagrada Familia and São Bento de Urânia jump from around 30% in 2020 to over 49% in 2024. Sede stays stable around 40% in both years.
Source: votacao_secao and consulta_cand (fields SG_PARTIDO, SQ_CANDIDATO), TSE, council race, 2020 and 2024. Same precinct→district mapping as Figure 6. The group's slate is defined by each year's mayoral coalition parties (Republicanos/PTB/Patriota in 2020; Republicanos/PP/PSDB in 2024), matched by SQ_CANDIDATO — not by name, which varies between the candidate and precinct extracts.
In absolute numbers
The percentages in Figures 6 and 6.1 hide the size of each district. The charts below show the total mayoral votes in each election from 2004 to 2024, with a line for the group's candidate, another for the main opposition and dots for the other candidates; the list above the charts names everyone. Each district has its own scale: Sede holds about two thirds of valid votes, and the other six districts are too small to share the same axis.
Seven line charts, one per district, with the total votes for each mayoral candidate in each election from 2004 to 2024: one line for the group's candidate, another for the main opposition and dots for the other candidates.
Source: votacao_secao, TSE, Mayor race, 2004 to 2024, blank and null votes excluded. Same precinct→district mapping as Figure 6.
The political flip in the City Council
Alfredo Chaves' City Council has 9 seats. In 2020, Hugo Luiz Picoli Meneghel's political base, then a council candidate for PTB on the majoritarian coalition “Mudança com Transparência” (PTB / Republicanos / Patriota), elected only 3 council members against 6 from opposing parties (the coalition that won the mayoral race: PP / PSB / PSDB, among others): a clear minority. In 2024, with campaign coordination extended to every council candidate on the “Renovação e Juventude” coalition (Republicanos / PP / PSDB), the slate's bloc grew to 5 of 9 seats, a simple majority, if a tight one.
Stacked horizontal bar chart comparing City Council composition: in 2020, 3 seats for the slate (green) against 6 for opponents (red); in 2024, 5 seats for the slate against 4 for opponents, flipping from minority to majority.
Adding up the nominal vote for every council candidate on the slate (elected and not), the growth shows up in the vote count too, not just the seats:
Bar chart comparing the combined votes of every council candidate on the slate: 3,427 votes (38.8% of the race) in 2020 versus 4,206 votes (43.8% of the race) in 2024.
Who ran each election
In the two charts below, green marks council members elected on Hugo Luiz's slate (the same political base in both elections); red marks those elected on opposing parties.
Horizontal bar chart with the 9 council members elected in 2020, colored by side: 3 from Hugo Luiz's slate in green, 6 from opponents in red.
Horizontal bar chart with the 9 council members elected in 2024, colored by side: 5 from the slate in green, 4 from opponents in red.
The mayoral vote pulled the council vote, but not equally in both elections
Mayor and council are separate votes on the same ballot: a voter can pick the group's candidate for mayor and an opponent for council, or the other way around. We cross-referenced, precinct by precinct, the share of valid votes for the group's mayoral candidate with the combined share of valid votes for the group's council candidates, in 2020 and in 2024.
Two side-by-side scatter plots, one for 2020 and one for 2024, each point a voting precinct, plotting the share of valid votes for the group's mayoral candidate against the combined share of valid votes for the group's council candidates. The correlation (r) is 0.66 in 2020 and 0.57 in 2024, with a dashed trend line in each panel.
Source: votacao_secao, TSE, 2020 and 2024. “Group,” for council races, defined by the same parties as the methodological note below. Pearson correlation (r) on the share of valid votes per precinct; includes straight-party votes (a vote for the party with no named candidate), attributed to the party voted for.
What it cost, and who showed up to vote
Data from the TSE's electoral campaign finance filings (revenue and expenses declared by every candidate, opponents included) and its turnout breakdown (attendance and abstention) round out the picture: the turnaround didn't come from a bigger electorate, and the revenue raised by the group's candidacy was only the largest among the competitors in 2024. In the five earlier defeats, the winner declared 1.5 to 4.4 times more revenue than the group's candidate. Even so, the group's campaign converted the money into votes more efficiently than any other candidate for the office in 2008, 2012, 2016, 2020 and 2024; in 2004 it was the second most efficient. The two figures below show every mayoral candidate of the six elections.
Six horizontal bar charts, one per election, with the revenue declared by each mayoral candidate from 2004 to 2024. In 2024, Hugo Luiz (PP, elected) declared R$155,597, Boldrini (PL) R$141,130 and Rolmar Boteccia (PSB) R$119,400; in 2020, Dr. Fernando (PSB, elected) R$108,642, Ronaldo Bianchi (Republicanos) R$53,120 and Armando Zanata (PDT) R$32,722. In the earlier elections the winner declared more than the group's candidate.
Six horizontal bar charts, one per election, with the spending efficiency per vote (paid expenses divided by votes) of each mayoral candidate from 2004 to 2024. The group's candidate was the most efficient, with the lowest spending per vote, in 2008 (R$13.36), 2012 (R$2.19), 2016 (R$10.65), 2020 (R$13.58) and 2024 (R$26.69); in 2004, Dr. Fernando had R$6.38 and Jorge Meneghel, R$7.44.
Horizontal bar chart comparing the slate's revenue sources in 2020 and 2024, by category: political-party funds, own funds, individual donors, and other candidates.
Turnout doesn't explain the 2024 turnaround, but it's been falling for twenty years
Between 2020 and 2024, the registered electorate grew just 4.6% (12,294 → 12,860) and turnout stayed practically flat: 79.15% in 2020, 79.74% in 2024. Since the slate's candidate grew 57% in absolute votes (3,681 → 5,779) while the total electorate barely moved, the turnaround was predominantly conversion of voters who already voted, not mobilization of new ones.
Stacked horizontal bar chart comparing turnout and abstention among registered voters: 9,731 voted and 2,563 abstained in 2020 (79.15%); 10,255 voted and 2,605 abstained in 2024 (79.74%).
Across all six elections, though, turnout isn't flat: it fell steadily, from 91.8% in 2004 to the 79-80% range of 2020 and 2024. The registered electorate grew 39% over that same period (2004: 9,247; 2024: 12,860), but the number of people who actually voted grew far less, 20.8% (2004: 8,492; 2024: 10,255), because a growing share of registered voters stopped showing up.
Line chart showing turnout for the mayoral election in Alfredo Chaves across six elections: 91.84% in 2004, 90.32% in 2008, 86.95% in 2012, 85.20% in 2016, 79.15% in 2020 and 79.74% in 2024, a steady decline that only levels off in the last two elections.
Source: detalhe_votacao_munzona, TSE, mayoral race, all six elections (2004 to 2024).
Electorate profile: almost nothing changed
The electorate's demographic profile (perfil_eleitor_secao data, TSE) also stayed stable over time. The gender split has been slowly converging toward parity every election: 51.7% men / 48.2% women in 2008, 51.1% / 48.8% in 2012, 50.6% / 49.3% in 2016, 50.2% / 49.7% in 2020, and 49.9% / 50.0% in 2024 (the TSE never published this figure for 2004). Practically fifty-fifty all along, with a steady trend toward a slight female majority.
Cross-referencing with IBGE: the electorate grew, the population didn't
To understand whether the electorate's growth (9,247 registered in 2004 → 12,860 in 2024, +39%) reflects the municipality growing, we cross-referenced TSE data with IBGE's annual population estimates (SIDRA, table 6579, municipality code 3200300). The answer is no: Alfredo Chaves' estimated population stayed practically flat over the period (14,113 in 2004, ~14,373 in 2024), with dips in some years. The electorate didn't grow because the municipality grew. It grew because an increasing share of the population already living there became registered to vote.
Line chart showing the percentage of IBGE's estimated population registered to vote in Alfredo Chaves: 65.5% in 2004, 72.7% in 2008, 80.7% in 2012, 79.6% in 2016, 84.0% in 2020, 89.5% in 2024.
QT_APTOS figure per year.Sex, race and income: do candidates look like the people who live here?
IBGE's 2022 Demographic Census (SIDRA, tables 9514 and 9605) makes it possible to go beyond total population and cross-reference sex and race/color with who actually runs for office. Alfredo Chaves' population is 49.3% women and 50.7% men, 61.4% white, 34.3% mixed-race (“pardo”) and 4.2% Black, numbers very close to the registered electorate's, which is also moving toward gender parity. Among candidates, though, the picture diverges: of the 69 council candidates in 2020, 37.7% were women; in 2024, out of 70 candidates, that share fell to 32.9%, the opposite of the electorate's trend, which keeps moving closer to 50%. Mayoral candidates are left out of these percentages: there are only three per election, and in both 2020 and 2024 all three were men.
Bar chart comparing the percentage of women across four groups: IBGE population in 2022 (49.3%), TSE electorate in 2024 (50.0%), council candidates in 2020 (37.7%), and council candidates in 2024 (32.9%).
The racial composition of the council candidacies follows a similar pattern. In 2020, white candidates were 59.4% of the total, close to the municipality's population share of 61.4%. By 2024 that share rose to 68.6%, while mixed-race candidates fell from 30.4% to 22.9%: a drift away from Alfredo Chaves' racial composition, even as the share of Black candidates grew slightly (7.2% → 8.6%). Among mayoral candidates, all three in 2020 were white; in 2024, two of the three were white and one was mixed-race.
Grouped bar chart comparing declared race or color among the 2022 IBGE population, 2020 council candidates, and 2024 council candidates, across white, mixed-race and Black categories. White: 61.4% population, 59.4% candidates 2020, 68.6% candidates 2024. Mixed-race: 34.3% population, 30.4% candidates 2020, 22.9% candidates 2024. Black: 4.2% population, 7.2% candidates 2020, 8.6% candidates 2024.
What the posts show about the race
This section steps outside the TSE dataset and uses a different source: the post history of the candidacy's official Instagram account (@hugoluiz11_), from the day of party affiliation through the election result. It isn't public, auditable data like the rest of this study. It's the campaign's own archive, reviewed post by post from screenshots exported from the app, with date, views, likes, comments and shares for each publication. We treat these numbers the way the campaign team saw them in real time: a measure of organic reach and engagement, not voting intention.
The timeline covers six milestones: affiliation to Progressistas (PP) on March 27, 2024; the pre-candidacy launch on June 7; the running-mate announcement for Cleber Bianchi, at the August 3 party convention; the public dispute over a suspended poll on September 22; the win on October 6; and the thank-you post for 5,779 votes, published hours after the result: the highest-engagement post of the entire campaign.
Scatter chart showing views on each Instagram post from the candidacy between March and October 2024, trending upward: from about 9,300 views on the affiliation post to peaks above 40,000 views in the home stretch and on the result.
Bar chart showing average engagement (likes plus comments plus shares) by campaign phase: 533 at affiliation, 223 in the pre-campaign, 232 at launch, 308 during the campaign, 308 in the home stretch, and 1,201 in the result phase.
We classified every one of the 166 posts identified by content type, to understand not just when reach grew, but what the campaign was actually posting. Street events and walks are the most common format (nearly a third of posts), followed by policy proposals, coalition posts, and routine administrative communication from the council-member term (City Council session notices, which the campaign posted in pairs: an invite beforehand, an explainer video after). But volume isn't the same as engagement: voter testimonials, which appear far less often, engage well above average, more than four times routine administrative communication.
Two horizontal bar charts. On the left, post count by category: 49 events or walks, 26 policy proposals, 19 coalition posts, 18 administrative posts, 13 testimonials, 10 responses to attacks, 7 polls, 7 countdowns, 6 holiday posts, 4 result posts, 3 milestones, 3 press-coverage posts, 1 affiliation post. On the right, average engagement by category, highest to lowest: result (1,201), milestone (601), affiliation (533), poll (394), testimonial (366), event (315), response to attack (298), coalition (296), proposal (280), holiday (267), press coverage (248), countdown (169), administrative (85).
Who the candidates were, beyond the votes
consulta_cand and bem_candidato data (TSE) bring age, education, occupation and declared assets for each candidate: public information, required by law at every election. Table 8.1 gathers the 16 mayoral candidates of the six elections, from 2004 to 2024, and Figures 23 and 24 compare them. The contrast with Hugo Luiz is the sharpest in the entire study.
age on election day, education and occupation from the candidacy registry, declared assets from the TSE
| Year | Candidate | Age | Education | Declared occupation | Declared assets |
|---|---|---|---|---|---|
| 2004 | Dr. Fernando (PSB) | 56 | College degree | Physician | — |
| 2004 | Jorge Meneghel (PT) | 37 | College degree | School teacher (primary and secondary) | — |
| 2004 | Luiz Teixeira (PV) | 50 | College degree | Lawyer | — |
| 2004 | Nelsão Togneri (PFL) | 41 | High school | Building technician | — |
| 2008 | Dr. Fernando (PSB) | 60 | College degree | Physician | R$ 53,416 |
| 2008 | Daniel Orlandi (PSDB) | 40 | High school | Farmer | R$ 15,000 |
| 2012 | Roberto Fiorin (PSB) | 53 | College degree | Federal civil servant | R$ 284,406 |
| 2012 | Sergio Bianchi (PSD) | 50 | Primary school, incomplete | Councilor | R$ 20,000 |
| 2016 | Dr. Fernando (PSB) | 68 | College degree | Physician | R$ 410,500 |
| 2016 | Ronaldo Bianchi (PMDB) | 54 | High school | Businessman | R$ 428,561 |
| 2020 | Dr. Fernando (PSB) | 72 | College degree | Mayor | R$ 620,761 |
| 2020 | Ronaldo Bianchi (Republicanos) | 58 | High school | Businessman | R$ 366,381 |
| 2020 | Armando Zanata (PDT) | 64 | High school, incomplete | Businessman | R$ 1,380,000 |
| 2024 | Hugo Luiz (PP) | 25 | College degree | Lawyer | R$ 29,573 |
| 2024 | Rolmar Boteccia (PSB) | 71 | High school | Cattle rancher | R$ 718,421 |
| 2024 | Boldrini (PL) | 61 | High school | Merchant | R$ 0 |
Six horizontal bar charts, one per election, with the age of each mayoral candidate on election day, from 2004 to 2024. In 2020: Dr. Fernando 72, Armando Zanata 64 and Ronaldo Bianchi 58; in 2024: Rolmar Boteccia 71, Boldrini 61 and Hugo Luiz 25.
Hugo Luiz was 25 on election day in 2024, holds a law degree from UFES, and, per the TSE's records, is white and single. The other two mayoral candidates that year were 61 and 71.
Five horizontal bar charts, one per election from 2008 to 2024, with the declared assets of each mayoral candidate. In 2020: Armando Zanata R$1.38 million, Dr. Fernando R$621 thousand and Ronaldo Bianchi R$366 thousand; in 2024: Rolmar Boteccia R$718 thousand, Hugo Luiz R$29.5 thousand and Boldrini R$0. The 2004 dataset has no assets.
The 9 registered election polls
The TSE maintains its own system for registering election polls (pesqele‑divulgacao.tse.jus.br), required under Article 33 of Law 9,504/97. For Alfredo Chaves in 2024, 9 polls are on record, from 5 different firms, between April and September. We opened and read all 9 registration filings in PDF. It's worth noting a real limit of the public data: the TSE doesn't publish the result (voting-intention percentage per candidate) in these filings, only formal confirmation of registration (firm, protocol, date, scope). It's the commissioning firm that releases the result, typically through a local press outlet.
Timeline of the 9 election polls registered for Alfredo Chaves in 2024, from 04/19 to 09/27, by 5 different firms, with election day (10/06/2024) marked in green.
We located the original document for 6 of the 9 polls: the full reports each institute produced for its client, with methodology, sample size and margin of error. Two of them (Apr 16 and Sep 21) had also been released to the press; the other four are real data, but restricted in circulation, never published by a press outlet:
- Apr 15–16, 2024: Instituto Solução (TSE ES‑09808/2024), 403 respondents, 4.9 p.p. margin, commissioned by AQUI NOTÍCIAS.COM (released).
- Aug 29–31, 2024: Instituto Veritá (TSE ES‑08806/2024), 352 respondents, 5.5 p.p. margin, commissioned by Marataízes Piúma Iriri Internet Ltda. (not publicly released).
- Sep 17, 2024: no institute or TSE registration number appears on the document (an atypical result, see the note below).
- Sep 20–21, 2024: Inove Consultoria (TSE ES‑04825/2024), 574 respondents, 4.0 p.p. margin, commissioned by H.A. Comunicações Ltda. (released by Montanhas Capixabas).
- Sep 27–29, 2024: Ipopes Pesquisa de Opinião Pública, 400 respondents (not publicly released).
- Oct 1–2, 2024: I9‑Inove Consultoria (TSE ES‑06358/2024), 373 respondents, 5.0 p.p. margin, commissioned by Portal ES Agora (not publicly released).
The six real-data points don't share one calculation basis: the Aug 29–31 poll and the official Oct 6 result sum to 100% among the three named candidates, but the Sep 20–21, Sep 27–29 and Oct 1–2 polls (the three 3-way polls with a gap) leave 9.6 to 23.75 percentage points unassigned, a sign those three report the share of the total sample (undecided included), not the share among named candidates. We normalize those three to sum to 100% among the names polled. The Apr 16 poll is different: it only had 2 names (Boldrini wasn't a candidate yet), and normalizing a 2-way race would artificially inflate both existing names, so that point appears with its raw value, as reported in the original document.
Line chart showing Hugo Luiz's prompted voting intention (green) at 54.8% (April, raw value from a 2-way race), 57.4% (August), 58.1% (Sep 21), 62.6% (Sep 28), 57.0% (Oct 2), and 58.05% in the official result; Rolmar Botecchia (red) between 21.3% and 32.6%; Boldrini (gray, dashed) between 10.0% and 21.3% from August on; and an isolated outlier data point from Sep 17 with Rolmar at 60.0% and Hugo at 25.8%.
* A result out of step with the other 5 polls and the final result; the document carries no TSE registration number or identified institute.
After the election: approval of the administration
This data comes from opinion polling, not the ballot box, and so falls outside the official TSE-based pipeline that underlies the rest of this study. Still, it helps round out the picture. In March 2026, already in the second year of the term, the Espírito Santo Institute for Research and Statistics (IPESES) surveyed 405 voters across the seat and districts of Alfredo Chaves (Mar 11–12, 2026, margin of error 4.9 p.p., 95% confidence, quotas by sex and age).
Sources: Aqui Notícias, Imprensa Capixaba and Informe Capixaba, all from March 2026, reporting the same IPESES poll.
Precinct by precinct, with polling location
The complete table of the mayoral candidacy's valid-vote share in every voting precinct, across both elections, plus the physical polling location of each precinct in 2024 (school, community hall, or church, per the TSE's official registry). Rows highlighted in green mark precincts that moved from a loss to an absolute majority. Raw vote counts and totals per precinct are in the repository's underlying data; here, the percentage already tells the story.
| Precinct | Polling location | % 2020 | % 2024 | Change | |
|---|---|---|---|---|---|
| 1 | EMEF ANA ARAÚJO | 37.8% | 52.1% | +14.3 p.p. | flipped |
| 2 | EMEF ANA ARAÚJO | 42.4% | 54.3% | +11.9 p.p. | flipped |
| 3 | EMEF ANA ARAÚJO | 41.1% | 51.3% | +10.2 p.p. | flipped |
| 4 | EMEF ANA ARAÚJO | 40.9% | 57.7% | +16.8 p.p. | flipped |
| 5 | EMEF ANA ARAÚJO | — | 57.5% | — | new precinct |
| 6 | EEEFM CAMILA MOTA | 42.8% | 54.6% | +11.8 p.p. | flipped |
| 7 | EEEFM CAMILA MOTA | 42.1% | 57.3% | +15.2 p.p. | flipped |
| 8 | EEEFM CAMILA MOTA | 45.5% | 54.4% | +8.9 p.p. | flipped |
| 9 | EMEF FAZENDA APARECIDA | 58.2% | 72.3% | +14.1 p.p. | |
| 10 | EEEF DE CRUBIXÁ | 32.5% | 44.6% | +12.1 p.p. | |
| 11 | EEEF DE CRUBIXÁ | 34.5% | 44.8% | +10.3 p.p. | |
| 12 | EMEF ENGANO | 42.2% | 63.2% | +21.0 p.p. | flipped |
| 13 | EMEF ENGANO | 37.5% | 63.4% | +25.9 p.p. | flipped |
| 14 | SALÃO DA IGREJA CATÓLICA DE SÃO FRANCISCO DE BATATAL | 47.4% | 52.7% | +5.3 p.p. | flipped |
| 15 | SALÃO DA IGREJA DE SÃO MARTINHO | 35.9% | 53.1% | +17.2 p.p. | flipped |
| 16 | PRÉDIO DA ANTIGA ESCOLA ALMERINDA BRUNORO | 36.2% | 43.9% | +7.7 p.p. | |
| 17 | EMEF FELIPE MODOLO | 46.9% | 65.7% | +18.8 p.p. | flipped |
| 18 | EMEF FELIPE MODOLO | 40.2% | 62.0% | +21.8 p.p. | flipped |
| 19 | SALÃO COMUNITÁRIO DE NOVA ESTRELA | 35.4% | 55.0% | +19.6 p.p. | flipped |
| 20 | SALÃO DA IGREJA CATÓLICA DE CACHOEIRA ALTA | 37.8% | 57.0% | +19.2 p.p. | flipped |
| 21 | EMUEF QUARTO TERRITÓRIO | 31.1% | 55.9% | +24.8 p.p. | flipped |
| 22 | EMEF SAGRADA FAMÍLIA | 31.6% | 58.0% | +26.4 p.p. | flipped |
| 23 | EMEF SAGRADA FAMÍLIA | 32.8% | 57.5% | +24.7 p.p. | flipped |
| 24 | SALÃO COMUNITÁRIO DE SÃO BENTO DE URÂNIA | 44.5% | 68.8% | +24.3 p.p. | flipped |
| 25 | EMEF FELIPE MODOLO | 27.8% | 48.2% | +20.4 p.p. | |
| 26 | EEUEF VILA NOVA DE MARAVILHA | 43.8% | 64.7% | +20.9 p.p. | flipped |
| 27 | EEEFM CAMILA MOTA | 45.3% | 55.7% | +10.4 p.p. | flipped |
| 28 | SALÃO DA IGREJA DE SÃO MARTINHO | 39.8% | 55.8% | +16.0 p.p. | flipped |
| 29 | SALÃO COMUNITÁRIO DE SÃO BENTO DE URÂNIA | 43.5% | 63.7% | +20.2 p.p. | flipped |
| 30 | EEEFM CAMILA MOTA | 38.1% | 54.9% | +16.8 p.p. | flipped |
| 31 | EEEFM CAMILA MOTA | 39.6% | 59.7% | +20.1 p.p. | flipped |
| 33 | EEEFM CAMILA MOTA | — | 56.2% | — | new precinct |
| 34 | EEEFM CAMILA MOTA | 44.4% | 59.5% | +15.1 p.p. | flipped |
| 35 | EEEFM CAMILA MOTA | 46.4% | 52.0% | +5.6 p.p. | flipped |
| 37 | CRECHE COMECINHO DE GENTE | 43.4% | 57.2% | +13.8 p.p. | flipped |
| 38 | CRECHE PEQUERRUCHOS | — | 63.8% | — | new precinct |
| 39 | CRECHE PEQUERRUCHOS | — | 68.3% | — | new precinct |
| 40 | SALÃO PAROQUIAL DA IGREJA DE NOSSA SENHORA DA CONCEIÇÃO | 43.6% | 67.1% | +23.5 p.p. | flipped |
| 41 | SALÃO PAROQUIAL DA IGREJA DE NOSSA SENHORA DA CONCEIÇÃO | 40.5% | 60.3% | +19.8 p.p. | flipped |
| 85 | CRECHE PEQUERRUCHOS | 29.8% | 63.3% | +33.5 p.p. | flipped |
| 96 | SALÃO COMUNITÁRIO DE SÃO BENTO DE URÂNIA | — | 78.9% | — | new precinct |
| 98 | EMEF FELIPE MODOLO | — | 57.3% | — | new precinct |
The 18 polling sites of the municipality
Alfredo Chaves' 42 voting precincts are spread across 18 physical polling locations, between the municipal seat and rural districts, all identified in the TSE's official registry:
| # | Polling location | Address | Precincts served |
|---|---|---|---|
| 1 | CRECHE COMECINHO DE GENTE | AV. DARCY DE PAULA GAIGHER, S/N | 37 |
| 2 | CRECHE PEQUERRUCHOS | RUA ANTÔNIO CLAUDIO GAIGHER, 19 | 38, 39, 85 |
| 3 | EEEF DE CRUBIXÁ | R. PRINCIPAL, S/ Nº | 10, 11 |
| 4 | EEEFM CAMILA MOTA | R. NELSON DA COSTA MELLO, S/ N | 6, 7, 8, 27, 30, 31, 33, 34, 35 |
| 5 | EEUEF VILA NOVA DE MARAVILHA | R. PRINCIPAL, S/ Nº | 26 |
| 6 | EMEF ANA ARAÚJO | R. EXPEDICIONARIO OSVALDO SAUDINO | 1, 2, 3, 4, 5 |
| 7 | EMEF ENGANO | R. PRINCIPAL, S/N | 12, 13 |
| 8 | EMEF FAZENDA APARECIDA | R. PRINCIPAL, S/ Nº | 9 |
| 9 | EMEF FELIPE MODOLO | R. PRINCIPAL, S/ N | 17, 18, 25, 98 |
| 10 | EMEF SAGRADA FAMÍLIA | R. PRINCIPAL, S/ N | 22, 23 |
| 11 | EMUEF QUARTO TERRITÓRIO | RUA PRINCIPAL, S/N | 21 |
| 12 | PRÉDIO DA ANTIGA ESCOLA ALMERINDA BRUNORO | R. PRINCIPAL, S/ N | 16 |
| 13 | SALÃO COMUNITÁRIO DE NOVA ESTRELA | R. PRINCIPAL, S/ N | 19 |
| 14 | SALÃO COMUNITÁRIO DE SÃO BENTO DE URÂNIA | R. PRINCIPAL, S/ N | 24, 29, 96 |
| 15 | SALÃO DA IGREJA CATÓLICA DE CACHOEIRA ALTA | R. PRINCIPAL, S/ N | 20 |
| 16 | SALÃO DA IGREJA CATÓLICA DE SÃO FRANCISCO DE BATATAL | RUA PRINCIPAL, S/ N | 14 |
| 17 | SALÃO DA IGREJA DE SÃO MARTINHO | R. PRINCIPAL, S/ N | 15, 28 |
| 18 | SALÃO PAROQUIAL DA IGREJA DE NOSSA SENHORA DA CONCEIÇÃO | AV. GETULIO VARGAS, 545 | 40, 41 |
Map of polling locations
The numbers on the map correspond to the # column in the table above. Because most rural addresses in the TSE registry have no street number (just “Main Street, no number”), the sites in the municipal seat (markers clustered close together, at the center of the map) are approximate, lightly spread apart just so they don't overlap; the rural-district sites correspond to the identified locality.

Click a number on the map to see the polling location.
Base map: © OpenStreetMap contributors. Coordinates from geocoding (Photon/Komoot) the location and district names in the TSE's registry.
What the data shows
Reading the results precinct by precinct, and then district by district, shows that the 2024 turnaround closes an arc of twenty years and six elections: from the 2004 candidacy to the 2024 win, two decades later. The group's vote share grew in nearly every cycle, with a single dip in 2020, and the 2024 result wasn't concentrated in a few strongholds: it was spread across nearly the entire electoral territory of the municipality, from the 42 precincts to the 7 districts, with an average gain of more than 20 percentage points in precincts where the majority flipped between 2020 and 2024. That's consistent with a strategy of territorial reach rather than reinforcing already-favorable bases: the one precinct already won in 2020 (precinct 9) saw a relatively modest additional gain (+13.7 p.p.) compared with precincts that started from a loss, and even the district historically most resistant to the group, Ribeirão do Cristo, went from 8.8% in 2004 to 72.3% in 2024.
The expanded campaign coordination in 2024, including for the first time the council candidacies, coincides with a second turnaround, now in the Legislature: the same political base that elected Hugo Luiz to the Council in 2020 with just 3 of 9 seats (an isolated minority) came to control 5 of 9 seats in 2024 (a simple majority), with a 22.7% increase in the combined vote for the slate's candidates. That suggests a coattail effect between the majoritarian and proportional races, though this analysis doesn't isolate causality between the two. What the 2028 scenarios do not do is in section 11; the study's limits and the author's position are in section 12.
What the numbers allow us to imagine for 2028
analysis/cenarios_2028.R), with the same TSE and IBGE data as the rest of the study.
How many votes will be at stake
The electorate grows almost linearly: 9,247 registered voters in 2004 and 12,860 in 2024. Extending that line to 2028 (linear regression with six points), the base scenario is 13,767 registered voters, with an 80% range of 13,091 to 14,443. With turnout and the share of valid votes between the 2020 and 2024 values (79.1% to 79.7% turnout; 94.7% to 97.1% of those present casting valid votes), that gives about 10,486 valid votes (9,810 to 11,180), against 9,955 in 2024.
Bar chart of valid votes for mayor from 2004 to 2024 and the 2028 base scenario, with 10,486 valid votes.
How much the group can lose and still lead
In Alfredo Chaves the candidate with the most votes wins: there is no runoff in a municipality with fewer than 200,000 voters. So the share needed to lead depends on the third candidate. With no third candidate, the group needs more than 50% of valid votes; with a third candidate at 10%, as in 2024, passing 45% is enough. Starting from 2024's 58.1%, the largest drop the group can withstand is −8.1 p.p. with no third candidate, −10.6 p.p. with a third at 5% and −13.1 p.p. with one at 10%.
Line chart with the group's vote margin over the opposition in 2028 for swings from −20 to +5 points, under three third-candidate scenarios.
starting from 2024's 58.1%, with 10,486 valid votes in 2028 (base scenario)
| Third candidate | Share needed to lead | Votes (base scenario) | Largest swing withstood |
|---|---|---|---|
| No third candidate | 50.0% | 5,243 | −8.1 p.p. |
| Third candidate at 5% | 47.5% | 4,981 | −10.6 p.p. |
| Third candidate at 10% (as in 2024) | 45.0% | 4,719 | −13.1 p.p. |
analysis/cenarios_2028.R) on resumo_prefeito_2004_2024.csv. Share needed = (100 − third) / 2, the percentage above which the group beats the main opposition.As a yardstick, the history itself: between consecutive elections the group's share swung from −8.0 to +18.1 p.p. (mean +6.3; standard deviation 9.8, with only five swings). If the 2028 swing followed that spread around zero, the result would fall between 45.6% and 70.6% in 80% of cases: a range far too wide to call a forecast, and one that includes precisely the 45% to 50% threshold.
And in the districts
Applying the same swing to every district (an unrealistic assumption, but useful to see where the advantage is most fragile), the group keeps more than 50% in 6 of the seven districts with a 5-point drop and in 3 with a 10-point drop. Sede, which holds about two thirds of valid votes, loses its absolute majority between −5 and −10 p.p.: that is where the lead is decided.
Map of the seven districts colored between red and green by the group's share in each swing scenario, with one button per swing from −20 to +5 points.
What this exercise does not do
- It does not know who the candidates will be. Nor whether the mayor elected in 2024 will run for re-election, nor how many slates there will be.
- It assumes a uniform swing. In practice districts swung in very different ways: Ribeirão do Cristo went from 9.4% in 2012 to 58.2% in 2020.
- It does not model re-election effects, the political climate, or polls. There are six data points; any more sophisticated model would be false precision.
The code that produces every number in this section:
# analysis/cenarios_2028.R (base R, no extra packages)
m_aptos <- lm(aptos ~ ano, data = compar)            # linear trend of the electorate
pred    <- predict(m_aptos, data.frame(ano = 2028),
                   interval = "prediction", level = 0.80)
votos_validos <- aptos * comparecimento * validos_sobre_comp

share_grupo    <- share_2024 + oscilacao              # uniform swing, in p.p.
share_oposicao <- 100 - share_grupo - terceiro        # third candidate: 0, 5 or 10%
margem <- (share_grupo - share_oposicao) / 100 * votos_validos
What this study cannot show
The study describes what public data shows. There are things the data does not show, and readers should know which ones before drawing conclusions.
What the data does not allow us to conclude
- Description, not cause. The numbers show where and when the vote changed, not why. The mayoral turnaround, the growth of the council slate and the wider campaign coordination coincide in time, but nothing here isolates the effect of one on another, nor separates the campaign from the political climate, rival candidates or local factors.
- Precincts and districts, not voters. Votes are counted by precinct and summed by district; no data says how each person voted. The correlations between the vote for mayor and for council (section 05) describe precincts and should not be read as individual behavior. This is the ecological inference problem.
- One municipality, no comparison. All the data is from Alfredo Chaves. The study does not compare with neighboring municipalities or the state average, so it cannot say how unusual the turnaround is for the region.
- Districts assigned by polling place. Each precinct's district comes from its 2024 polling place (section 04). Because precincts in this municipality only receive new numbers and none is renumbered, the assignment holds for every year, but it is still an assignment, not a TSE field.
- Uneven coverage across years. Table 3.1 shows what exists for each election. Where a dataset does not cover a year, the analysis is left out rather than estimated.
- Short series. There are six elections. That is why the 2028 scenarios (section 11) are stated assumptions, not forecasts.
- Two sources that cannot be audited in the same way. The candidacy's Instagram posts (section 07) were read from screenshots, and the TSE registers the 2024 polls without publishing their results (section 08).
The author's position
I was the 2024 campaign director, the child of a 2004 candidate and the brother of the candidate elected in 2024. That can tilt what I chose to analyze and how I framed the result. To reduce the risk, I used only public, reproducible data, with no internal campaign spreadsheets or records; I left the code in the repository so anyone can redo the calculations from the same extracts; I kept in the study the results that are unfavorable to the group (the five consecutive defeats from 2004 to 2020); and I used neutral language, “group” and “opposition”. This does not remove the bias. It only makes it checkable.
Skills, one by one, and where they show up
This table ties each skill to a verifiable part of the study and the repository. Everything here can be checked in the code or the data.
| Skill | What was done | Where to look |
|---|---|---|
| SQL | A SQLite database with all six elections (5 tables and 2 views) and five queries using CTEs, window functions and joins, automatically checked against the pandas pipeline. | Section 03; sql/ folder and scripts/sql_estudo.py |
| Pipeline and data quality | Ingestion of TSE and IBGE extracts whose format changes between 2004 and 2024, explicit cleaning rules and declared coverage. The cross-check between SQL and pandas caught and fixed a denominator error in the per-precinct percentages (blank and null ballots inside the total). | Sections 02 and 03; Table 3.1 |
| Visualization | Interactive charts in TypeScript, React and Recharts, a district map with IBGE polygons, alternative text on the charts, mobile reading and a PDF generated from the page itself. | Sections 04 to 11 |
| Statistics | Percentage-point changes by precinct and district, coherence between the mayoral and council vote in each precinct, sensitivity scenarios for 2028 in R with declared assumptions, and explicit limits of inference. | Sections 05, 11 and 12 |
| Data storytelling | A twenty-year arc (five defeats, the turnaround, the territory, the financing, the scenarios), numbered figures whose captions state the conclusion, versions in Portuguese and English, and a declared conflict of interest. | Sections 00 to 12 |
| Reproducibility | Every number links to a public TSE or IBGE extract, the run steps are in the repository, and results unfavorable to the group were kept. | Sections 02 and 12; the repository README |